Gulf war / Hormuz · Strature analysis, not from the brief
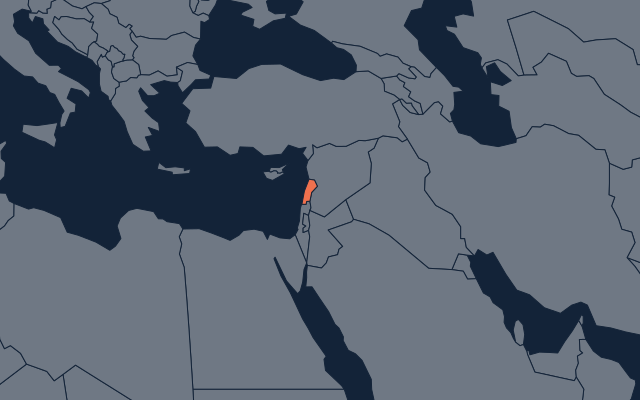
Gulf war / Hormuz: what is at stake for Lebanon
Lebanon sells 28.6% of its goods exports to the GCC and Iran, most of it to the UAE. A Gulf slowdown would add to a 2026 contraction the World Bank puts at 6.4%.
28.6%
Exports to GCC6 and Iran, % of total (2024)
US$1.228bn
Exports to GCC6 and Iran, US$ bn (2024)
US$6.696bn
Remittances, US$ bn (2023; Gulf share unknown)
16.4%
Gulf share of product imports (2024)
Read the full panel
Risks
- Gulf market. The UAE alone took 24.1% of exports in 2024. Saudi Arabia buys almost nothing since a 2021 ban.
- Fuel prices. Lebanon imports 3.021 Mt of products a year. A US$15 rise in oil would add about US$0.34bn a year, 1.3% of GDP (our estimate, scored when it resolves).
- War at home. The World Bank expects the economy to shrink 6.4% in 2026. The 2023 and 2024 fighting cost US$14bn.
Opportunities
- Diverse fuel suppliers. Greece alone supplied US$1,467.0m of products in 2024, more than the Gulf; Egypt and Turkiye were also large suppliers, and the Gulf share was 16.4%.
- Reconstruction finance. Needs from the 2023 and 2024 fighting alone were US$11bn; Gulf donors are possible funders.
Uncertainties
- The Gulf share of remittances, which were 33.35% of GDP in 2023. No figure by country was found.
- How much of the UAE trade is gold re-exported through Dubai. Lebanon's gold exports were US$278.1m in 2024.
- The cost of the 2026 fighting, not yet assessed.
What to watch
- 20 Nov 2026The registered strike forecast resolves.
- Twice a yearWorld Bank Lebanon Economic Monitor and damage assessment.
- MonthlyFuel import prices and exports to the UAE.
Exposure by lens
| Lens | Figure | Band | Published line |
|---|---|---|---|
| Exports to the GulfTrade | 28.6% of exports 2024Share of goods exports to GCC6 and Iran | High | High ≥25% · Medium 10–25% · Low 5–10% |
| Refined productsDependence | 16.4% 2024Share of refined product imports (HS 2710) from Gulf producers | Low | High ≥40% · Medium 20–40% · Low 10–20% |
Bands follow the published materiality lines for this theme. A low-confidence figure alone caps a band at Medium.
GulfTotals
Drawn to scale from zero. Source: UN Comtrade (public API): LBN exports, all goods, by partner 2024; UN Comtrade (public API): LBN exports, all goods 2024.
Briefs and questions
- C-002 · Where does exposure to Iran sit? Gulf capital and markets
- S-001 F-0074 Renewed strike on Iran by 20 Nov 2026 (61%), our estimate, scored when it resolves.
Sources cited
- UN Comtrade (public API): LBN exports, all goods, by partner 2024 (2024; retrieved 6 Oct 2026)
- World Bank WDI API, BX.TRF.PWKR.CD.DT (2023; retrieved 6 Oct 2026)
- UN Comtrade (public API): LBN imports HS 2710 by partner 2024 (2024; retrieved 6 Oct 2026)
- World Bank, Lebanon overview (2026; retrieved 6 Oct 2026)
- World Bank WDI via API: Personal remittances, received (% of GDP), BX.TRF.PWKR.DT.GD.ZS (2023; retrieved 6 Oct 2026)
- UN Comtrade (public API): LBN exports HS 7108 by partner 2024 (2024; retrieved 6 Oct 2026)
- UN Comtrade (public API): LBN exports, all goods 2024 (2024; retrieved 6 Oct 2026)
Our calculations
- Share of goods exports to GCC6 and Iran: 28.6% of exports (= 1.228 / 4.290)
- UAE share of goods exports: 24.1% of exports (= 1.0347 / 4.2896)
- Scenario: extra product import bill in a year if a renewed strike adds US$10-20/bbl: US$0.34bn per year (= 3.021 × 7.45 × 15)
- Scenario: extra annual product bill as % of GDP: 1.3% of GDP (= 0.34 / 25.972)
- Scenario: exports lost if Gulf demand falls 10% for a year: US$0.12bn per year (= 0.10 × 1.228)
Strature analysis, not from the brief: researched by Strature from public sources and kept in our country dossier, updated 6 Oct 2026. General research, not advice. Who is exposed to the Gulf war / Hormuz