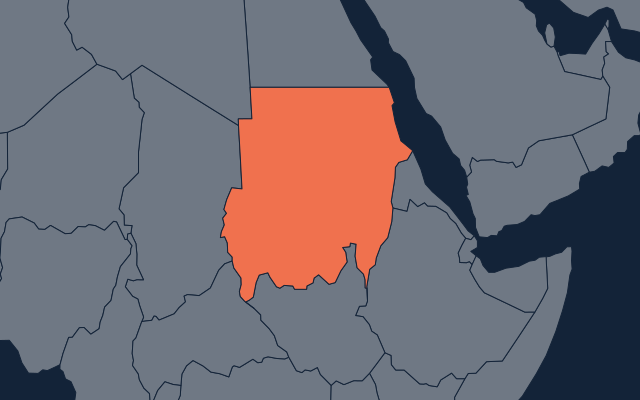
Gulf war / Hormuz · Strature analysis, not from the brief
Gulf war / Hormuz: what is at stake for Sudan
Sudan, already at war, feels the Gulf war through fuel and food prices. Diesel nearly doubled between Mar and Aug 2026, and 19.5 million people face acute food insecurity.
31%est.
Middle East share of oil use (IEA proxy, 2024)
US$1.032bn
Gold sold to the UAE, US$ bn (2023)
19.5
People in IPC Phase 3 or worse, million (2026)
2.8
Cereal import requirement, Mt (2026)
Read the full panel
Risks
- Fuel. Diesel prices nearly doubled between Mar and Aug 2026. About 31% of oil use comes from the Middle East. Estimate from press or commentary
- Food. The 2026 cereal import requirement is 2.8 Mt, after a poor 2025 harvest of 5.2 Mt. The wheat price rose from US$257.6 to US$347 a tonne.
- Gold income. The UAE reported US$1.0315bn of gold imports from Sudan in 2023, about 1.7% of 2025 GDP.
Opportunities
- Farm exports. Sudan is a nearby farm supplier for Gulf food importers, but its own war and a 2025 harvest 22% below 2024 limit what it can export.
- Red Sea coast. Port Sudan lies on the Red Sea, where Saudi Arabia rerouted about 4 mb/d of crude to Yanbu during the closure (press estimate); no gain for Sudan has been measured. Estimate from press or commentary
Uncertainties
- Sudan has not reported trade since 2023; partner shares are mirror data.
- The Gulf share of remittances, which were US$1.499bn in 2022.
- How much fuel reaches the country through Port Sudan during the war.
What to watch
- MonthlyFAO and WFP prices for diesel, sorghum and wheat.
- 20 Nov 2026The registered strike forecast resolves.
- Oct-Dec 2026The 2026 harvest, after 2025 cereal output fell 22% below 2024.
Exposure by lens
| Lens | Figure | Band | Published line |
|---|---|---|---|
| Refined productsDependence | 31%est. 2024Middle East share of domestic oil consumption | Medium | High ≥40% · Medium 20–40% · Low 10–20% |
| Gulf capitalCapital and finance | 1% GDP 2024 low confidenceGulf deposits as % of GDP | Below line | High ≥10 or ≥25% of FX reserves · Medium 2–10% · Low <2 but ≥US$1bn |
Bands follow the published materiality lines for this theme. A low-confidence figure alone caps a band at Medium.
GulfElsewhere
Drawn to scale from zero. Source: World Bank Commodity Price Data (Pink Sheet), monthly prices, October 2026 release.
Briefs and questions
- T-003 · Had Hormuz crude flows recovered by late September 2026? Products
- S-001 · Does a strike translate into a published war-risk premium? Red Sea
- S-001 F-0074 Renewed strike on Iran by 20 Nov 2026 (61%), our estimate, scored when it resolves.
Sources cited
- UN Comtrade (public API): ARE imports HS 7108 from SDN 2023 (2023; retrieved 6 Oct 2026)
- FAO GIEWS country brief: Sudan (24 Sep 2026) (2026; retrieved 6 Oct 2026)
- World Bank Commodity Price Data (Pink Sheet), monthly prices, October 2026 release (2026-09; retrieved 6 Oct 2026)
- World Bank WDI API, BX.TRF.PWKR.CD.DT (2022; retrieved 6 Oct 2026)
Estimates from press or commentary
- Ranked: Which Countries Depend Most on Middle East Oil? (Visual Capitalist, data IEA World Energy Statistics 2024) (2024; retrieved 6 Oct 2026)
- Reuters via US News, Saudi Arabia restarts East-West oil pipeline (22 Sep 2026) (Mar-Sep 2026; retrieved 6 Oct 2026)
Our calculations
- Gulf deposits as % of GDP: 1% GDP (= 0.5/49.67; 2019 stock vs 2024 GDP, war since 2023)
- Gold sold to the UAE as % of GDP: 1.7% of GDP (= 1.0315 / 60.163)
- Scenario: extra cereal import cost in a year at the Sep 2026 wheat price: US$0.25bn per year (= 2.8 Mt × (347 - 257.6) US$/t)
- Scenario: extra cereal import cost as % of GDP: 0.42% of GDP (= 0.25 / 60.163)
Strature analysis, not from the brief: researched by Strature from public sources and kept in our country dossier, updated 6 Oct 2026. General research, not advice. Who is exposed to the Gulf war / Hormuz