Gulf war / Hormuz · Strature analysis, not from the brief
Gulf war / Hormuz: what is at stake for Australia
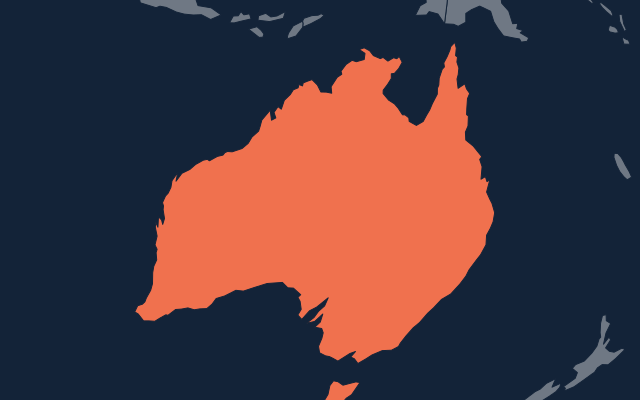
Australia's direct stake is urea: Hormuz producers supplied 54.3% of 2024 imports. Its fuel comes from Asian refineries that run largely on Gulf crude.
2.14
urea from Hormuz producers (2024)
US$32.79bn
refined product import bill (2024)
49.6%
Gulf crude inside product imports (our calculation)
US$44.52bn
LNG exports (2024)
Read the full panel
Risks
- Urea for planting: 2.14 Mt of the 3.85 Mt imported in 2024 came from Hormuz producers.
- Fuel stocks were about 29-36 days of use in Apr 2026 (an estimate); the IEA's 90-day rule is counted differently, in days of net imports. Estimate from press or commentary
- Singapore alone supplies about 20% of Australia's refined fuel and draws much of its crude from the Gulf. Estimate from press or commentary
- The fuel excise was cut 50% in Mar 2026 (an estimate); a further cut would cost more revenue. Estimate from press or commentary
Opportunities
- LNG exports were US$44.52bn in 2024, and Australia was already Singapore's largest LNG supplier (34.7%), so Asian buyers replacing Qatari LNG may turn to it.
- Urea from outside the Gulf is close by: Indonesia was the next-largest supplier in 2024, and 340 kt of extra imports were authorised in 2026.
Uncertainties
- Fuel stock days come from a Wikipedia summary, not the official petroleum statistics, which could not be reached. Estimate from press or commentary
- The embedded Gulf crude share assumes suppliers' 2024-2025 crude slates; several cut Gulf crude after the war began.
- Farm exports to the Gulf, such as live sheep and barley, may lose buyers, but no trade figures since the war began were found.
What to watch
- 20 Nov 2026F-0074 resolves; a renewed strike before the next autumn planting would test urea supply.
- MonthlyAustralian Petroleum Statistics: days of cover for diesel, petrol and jet.
- MonthlyUrea imports by origin and the Middle East urea price, against US$780 a tonne at the April peak.
- QuarterlyWhether the excise cut is extended or reversed.
Exposure by lens
| Lens | Figure | Band | Published line |
|---|---|---|---|
| Fertiliser (urea)Food and farming | 54.3% 2024Share of urea imports from Hormuz-dependent Gulf producers (excluding Oman) | High | High ≥50% · Medium 25–50% · Low 10–25% |
Bands follow the published materiality lines for this theme. A low-confidence figure alone caps a band at Medium.
GulfElsewhere
Drawn to scale from zero. Source: WITS/UN Comtrade: AUS urea (HS 310210) imports by partner 2024; WITS/UN Comtrade: AUS DAP (HS 310530) imports by partner 2024; WITS/UN Comtrade: AUS crude (HS 270900) imports by partner 2024; WITS/UN Comtrade: AUS petroleum products (HS 271000) imports by partner 2024. * Our calculation from the cited figures.
Briefs and questions
- T-003 · Which economies are most exposed to the Gulf fertiliser shock? Gulf economies supply about a quarter of world nitrogen fertiliser exports.
- T-003 · Had Hormuz crude flows recovered by late September 2026? Refined products recovered least after the reopening.
- S-001 F-0074 Renewed US or Israeli strike on Iran by 20 Nov 2026, 61%, our estimate, scored when it resolves.
Sources cited
- WITS/UN Comtrade: AUS petroleum products (HS 271000) imports by partner 2024 (2024; retrieved 6 Oct 2026)
- WITS/UN Comtrade: AUS LNG (HS 271111) exports 2024 (2024; retrieved 6 Oct 2026)
- WITS/UN Comtrade: AUS urea (HS 310210) imports by partner 2024 (2024; retrieved 6 Oct 2026)
- WITS/UN Comtrade: SGP LNG (HS 271111) imports by partner 2024 (2024; retrieved 6 Oct 2026)
- Argus: Middle East conflict disrupts global urea trade and pricing (market opinion blog, 2026) (2026; retrieved 6 Oct 2026)
- UN Comtrade (public API) (2023; retrieved 6 Oct 2026)
- UN Comtrade (public API) (2023; retrieved 6 Oct 2026)
- WITS/UN Comtrade: AUS DAP (HS 310530) imports by partner 2024 (2024; retrieved 6 Oct 2026)
- WITS/UN Comtrade: AUS crude (HS 270900) imports by partner 2024 (2024; retrieved 6 Oct 2026)
Estimates from press or commentary
- Wikipedia: 2026 Iran war fuel crisis (Australia section) (Apr 2026; retrieved 6 Oct 2026)
- ABC News: Singapore's major oil source is blocked and experts warn Australians will pay (2 Apr 2026) (2026; retrieved 6 Oct 2026)
Our calculations
- Urea imports from Hormuz Gulf producers, volume: 2.14 Mt (= 0.780 + 0.601 + 0.595 + 0.161 Mt (WITS partner rows))
- Gulf crude embedded in refined product imports (import share x supplier's Gulf crude share): 49.6% of product imports (= sum over suppliers of (share of product imports by value × supplier's Gulf share of crude imports): Korea 28.8% × 69.9%; Singapore 21.6% × 52.3%; Malaysia 13.9% × 48.7%; India 8.9% × 45%; Taiwan 7.9% × 61%; China 6.6% × 39.7%)
- Scenario: extra cost of replacing one quarter of Hormuz-Gulf urea at the April 2026 peak premium: US$0.24bn (= 2.14 Mt / 4 × (780 - 330) US$/t = 0.534 Mt × 450 = US$0.24bn)
- Scenario: extra refined product import bill for one quarter if prices rise 15%: US$1.23bn per quarter (= 32.79 / 4 × 15% (10-20%))
- Scenario: one-quarter cost (fuel + urea) as % of GDP: 0.08% of GDP (= (1.23 + 0.24) / 1798.52 = 1.47 / 1798.5)
Strature analysis, not from the brief: researched by Strature from public sources and kept in our country dossier, updated 6 Oct 2026. General research, not advice. Who is exposed to the Gulf war / Hormuz